How To Calculate Conversion Rate: Formula


Summarize
Read on to learn how conversion rate is calculated and which formula to use for different digital scenarios. This information will be useful for both novice marketers and more experienced experts.
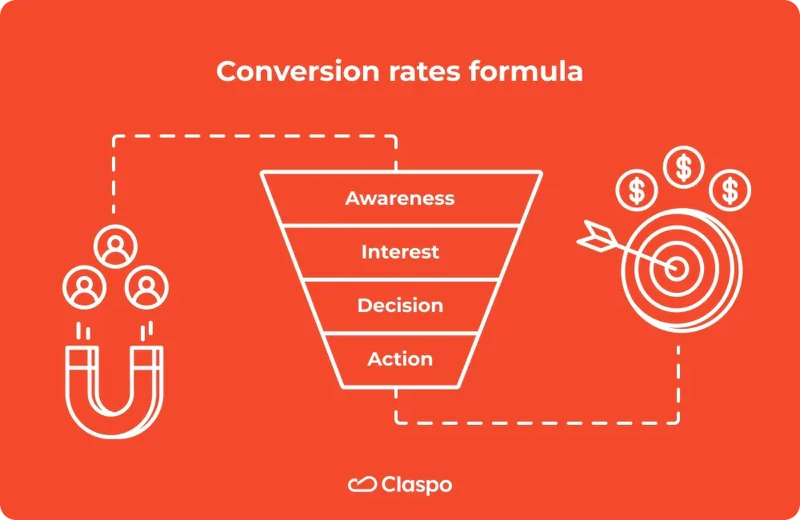
Conversion rate formula
A universal conversion rates formula is used in almost all scenarios digital marketers encounter. It looks as follows:

Targeted actions usually refer to sales. But even in e-commerce, alternatives can be considered. These include:
newsletter subscription;
registration on the site;
filling out the survey form;
adding an item to the cart;
a call to the manager;
addressing the chatbot;
studying technical specifications.
The list of targeted actions in the services field will be even more extensive. It includes file downloads, utilizing certain features of SaaS services, expanding cloud storage capacity, and more.
The numerator of the conversion calculation formula always remains the same. However, the denominator varies depending on the company's area of activity, sales funnel design, and even specific customer interaction scenarios.
If you work in e-commerce and sell products so popular that people may buy them several times a day, the formula should be adjusted. To understand how to calculate conversion rates correctly, you need to replace the traffic in the denominator with the number of sessions.
The number of sessions is individual visits to the site that end when a user closes a browser tab or after a certain amount of time. By default, the maximum session duration in most analytics services is 1 hour, but you can change this value if you want. So, the formula for the most popular products is as follows:

The situation is completely different when you offer a long-term subscription to a service, newsletter or online service. In this case, it doesn't matter how often a user visits the site: they won't be able to make more than one subscription.
Therefore, it is rational to take into account the number of unique visitors in the conversion rates formula. This will help to assess the success of your project much more accurately:

Let's imagine another situation. You are engaged in email marketing and send out tens of thousands of emails. They have low clickability, but such communications are very affordable.
That's why you're more likely to be interested in conversions among those who opened the email, not just those who received and ignored it. The situations may differ, but the essence is the same. In the conversion rate calculation methodology, we will replace traffic with the number of leads:

The conversion rate is calculated in all cases when a targeted action includes paid advertising. That’s the reason why the total audience of your campaign is taken into account in the formula.

A completed action can be considered not only as a conversion but also as a transition to the next stage of the sales funnel. In this case, the formula is as follows:

Examples of Conversion Rate Calculation
Let's take a look at conversion rate calculation using specific examples. This will help you understand how certain techniques work in real-life scenarios that professionals face on a daily basis.
Total conversion rate
On average, 150 thousand people visit an online store per week. 120 thousand of them browse product cards, 42 thousand add products to the cart, and 11 thousand complete the transaction by paying for the purchase. In this example, we can see how the conversion rate is calculated at different stages:
if you take product browsing as a targeted action: 120/150 × 100% = 80%;
adding a product to the cart: 42/150 × 100% = 28%;
purchase: 11/150 × 100% = 7.3%.
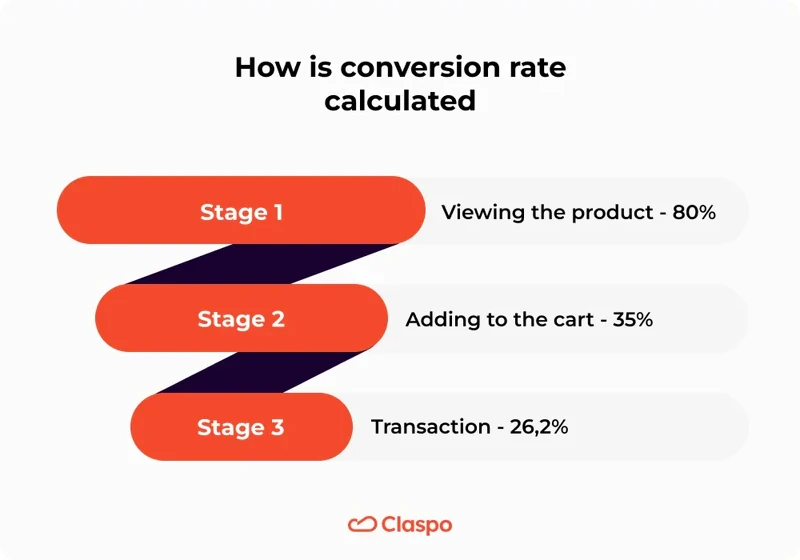
You can also calculate conversion rates in stages. This allows us to clarify how well each stage of the sales funnel is performing. For example:
conversion rate on the transition from visiting to viewing the product = 80%;
conversion at the stage between browsing and adding to the cart: 42/120 × 100% = 35%;
conversion at the stage between adding to cart and transaction: 11/42 × 100% = 26.2%.
In our example, the sales funnel works quite effectively. A decrease in conversions as a buyer moves through the funnel is normal. However, if we see slippage in the early stages, this would be a serious reason to reconsider your marketing approach.
Conversion rate by communication channel
Vertical comparisons are not the only way to get good results in terms of analysis. Horizontal comparisons can be used to evaluate how effectively each communication channel works. For example, a company develops its own SaaS service and promotes it in the following ways:
SEO — 12 thousand unique users, 865 subscriptions;
PPC — 4 thousand unique users, 399 subscriptions;
social media —1200 unique users, 216 subscriptions;
email newsletters — 800 unique users, 113 subscriptions;
affiliate programs — 30 unique users, 16 subscriptions.
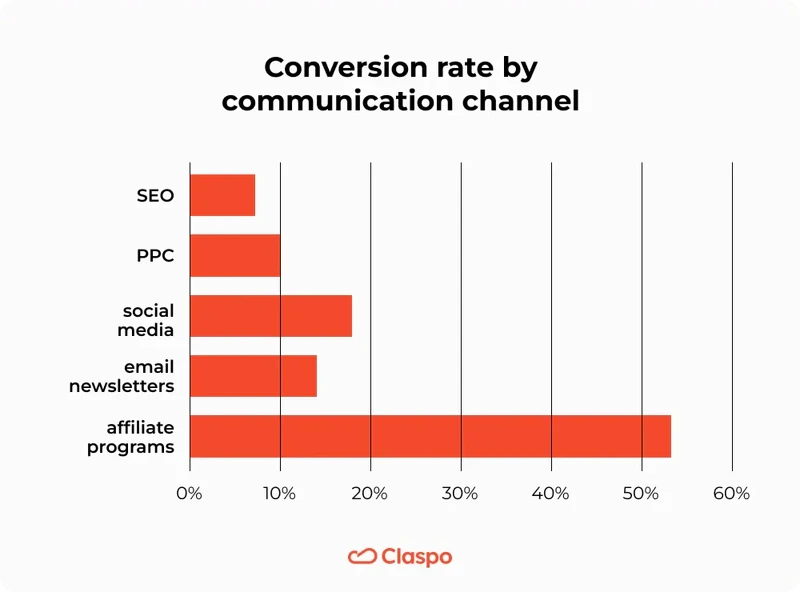
Using conversion rates formula #3, which takes into account the number of unique users, we get the following results:
SEO — 865/12000 × 100% = 7.2%;
PPC — 399/4000 × 100% = 10.0%;
social media — 216/1200 × 100% = 18.0%;
email newsletters — 113/800 × 100% = 14.1%;
affiliate programs — 16/30 × 100% = 53.3%.
What would be the best value? Intuitively, we want to choose the highest value, but the catch is that this is not always the right course of action. Every communication channel will have different norms. It's best to focus on the market average in your industry or the marketing performance of top competitors.
Another important issue is the potential audience size. In our example, SEO may show the lowest conversion rate, but investment in it can bring the best results due to the huge number of search engine users.
Conversely, due to the limited audience, financial investments in incredibly effective affiliate programs may not bring the expected results.
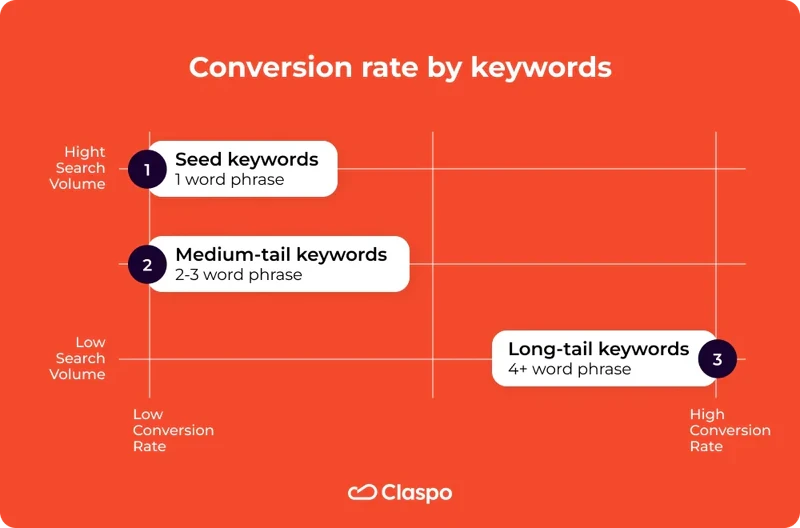
Keyword Conversion Rate
Some key queries perform better than others due to an attractive combination of words, low competition, or other factors. For example, a company launched 5 advertising appeals with different key phrases and got the following results:
Buy a car in the LA area — 1.5 million impressions, 45,000 clicks.
Buy used Chevrolet Tahoe in LA — 98,000 hits, 12,000 clicks.
Cheap used cars for sale in the LA area — 600,000 hits, 20,000 clicks.
Large SUVs for sale cheap in Los Angeles — 22,000 impressions, 8,600 clicks.
Best used car dealership in the LA area — 46,000 impressions, 1,800 clicks.
Let's use the conversion rate formula #5, created specifically to analyze the effectiveness of paid advertising:
45/1500 × 100% = 3.0%
12/98 × 100% = 12.2%
20/600 × 100% = 3.3%
8,6/22 × 100% = 39.1%
1,8/46 × 100% = 3.9%
The analysis shows that all other things being equal, ad campaigns with the keywords "Buy used Chevrolet Tahoe in LA" and "Large SUVs for sale cheap in Los Angeles" perform better. They bring in more clicks at a lower cost. You can use this data to improve your existing marketing strategy or develop a new one.
Time Period in Calculation of Conversion Rate
Typically, marketing performance analysis is done once a week. This frequency will be a necessary minimum in the fast-changing world of e-commerce. By increasing the intervals between observations, you run the risk of not noticing new trends and letting your competitors get ahead of you.
The more often you calculate your conversion rate, the better. If your approach to website promotion involves measuring key metrics on a daily basis, don't change it. Observing the dynamics of conversion rates will be a great incentive to search and test new ideas.
However, performing manual measurements at this calculation frequency is irrational and time-consuming. You can entrust this task to specialized tools like Google Analytics, Serpstat, SE Ranking, or Sitechecker.
Another convenient option is to use built-in analytics modules in services to increase conversion rates. For example, Claspo allows you to create pop-ups and evaluate the effectiveness of each widget individually. The built-in analytics service allows you to calculate the conversion rate of pop-ups for a selected period to track the dynamics of key marketing performance indicators.
How to Work with the Results
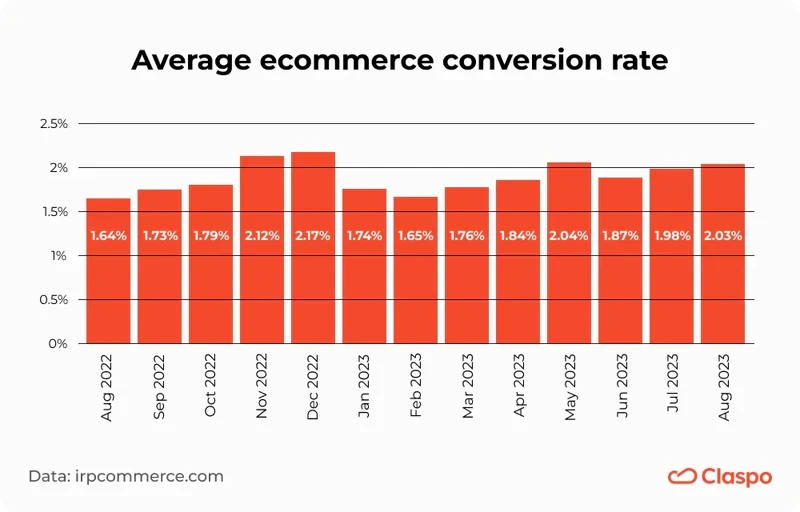
First of all, you need to determine how effectively your marketing works. For this purpose, you will have to compare the final calculation results obtained with the help of the conversion rates formula with the benchmark.
Since there is no single standard all companies can rely on, focus on the average market level of conversion in your niche. You can find it in market research or look at your competitors using analytics services.
Look for up-to-date data, ideally for the calculation period and, if possible, for the last month or quarter.
The comparison can show you 2 things:
Your conversion rate is lower than the market average. This means that your marketing strategy is not working effectively enough. You can find out why you are facing such problems in our article "10 Reasons That Your Conversion Rate Is So Low".
Your conversions are at or above the market average. This means that you have chosen the right strategy. In such a case, remember that there are always ambitious competitors aiming to beat you in the shortest possible time. So, keep experimenting, testing new hypotheses, and analyzing the results.
Conversion rate can also be used for:
comparing the effectiveness of page promotion, advertising campaigns, and communication channels;
selecting priority areas for development and investment;
selection of new effective tools for online business promotion;
to find problem areas in the sales funnel;
optimizing user and customer experience.
Increase your Conversion Rate with Claspo
Pop-ups are one of the easiest and most effective tools to increase conversions. You can use them to drive sales, motivate users to sign up for a newsletter, or collect personal customer data. And all this — without programming or rendering the design!
Claspo offers a vast library of ready-made popups for your websites with the possibility of personalization. You can rearrange their blocks, add new elements, and edit text blocks.
Claspo also provides you with its own analytics module. You can track the conversion rate of the popup for a selected period and choose the best option for each page of the website. The A/B testing feature allows you to test hypotheses in real scenarios, getting results backed up by numbers.
Try Claspo today and take your business efficiency to the next level! Test the service for free and choose the perfect plan to match your website traffic.


