Bounce Rate vs Exit Rate: What's The Difference


Summarize
Comparing the bounce rate vs exit rate will help you evaluate the performance of each page on your website. Each indicator has a high value, but combined, they will be most informative.
Let's explore how these values are calculated, how to interpret them, and where to look for the correct numbers in Google Analytics 4.
What is Bounce Rate and Exit Rate
To understand the difference between exit rate and bounce rate, let's look at the definitions of these metrics and the formulas for calculating them.
Bounce rate is the share of sessions in which a user visited only one page of a site without taking targeted actions. It is calculated according to the following formula:

Exit rate is the share of sessions in which a user closed the site after navigating a specific page. It is calculated using the following formula:

At first glance, the difference between the exit (drop off) rate vs bounce rate is minimal. But in reality, they have fundamental differences worth discussing in more detail.
What is the Difference Between Bounce Rate and Exit Rate
Only those sessions that started and ended on a particular page are considered bounces. For example, a visitor clicks a link and closes the site without exploring other sections of the web resource, leaving contact information, subscribing, or buying a product.
Exit simply means closing the site regardless of a user's previous actions and motivation. It does not matter how many pages a visitor viewed, how many products they bought, or how many data collection forms they filled out. Leaving the site increases the exit rate of the page where the session ends.
The difference between bounce rate and exit rate is that bounce rates can be prevented by motivating users to explore the site more deeply. Exits, on the other hand, are an inevitable phenomenon that ends any session. Bounce rates can be reduced site-wide, while exit rates can only be redistributed between different pages. However, both measures can increase the effectiveness of the web resource with the right approach.
Bounce Rate and Exit Rate in Google Analytics: Which Metric is More Important
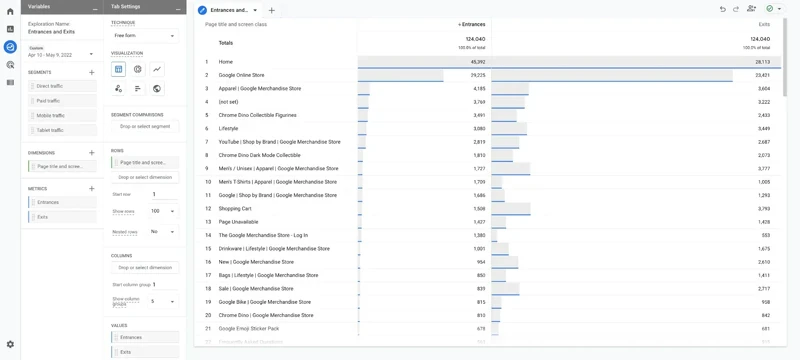
To begin with, we need to figure out how to get the necessary metrics in the analytics service. The service automatically calculates both metrics, although not in the standard reports. The most convenient way to display them is to create a new custom form and add the necessary variables. Follow the instructions below:
1. Log in to your Google Analytics administrator account 4.
2. Select the desired project.
3. Click on "Explore" in the menu on the left.
4. Select the "Free form" section.
5. Scroll to the end of the menu on the left and find the "Metrics" section.
6. Click on the "+" button.
7. In the "Sessions" section, select the "Bounce Rate" metric.
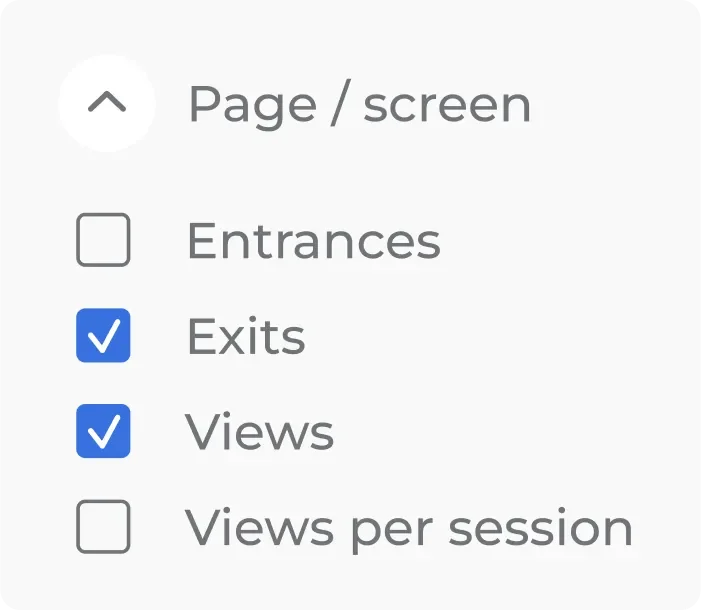
8. In the "Page/Screen" section, select "Views" and "Exits".
9. Click "Import."
10. Find the "Dimensions" section above.
11. Click on the "+" button.
12. In the "Page/Screen" section, select the "Page location" indicator.
13. Click "Import."
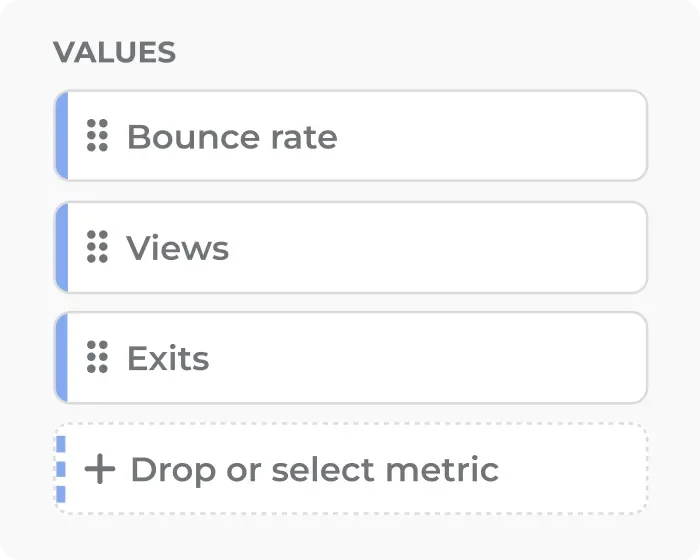
14. Drag and drop the desired metrics from the "Variables" column to "Tab Settings".
15. Customize the table - select the time period, number of rows, and other parameters.
16. Sort by priority indicator.
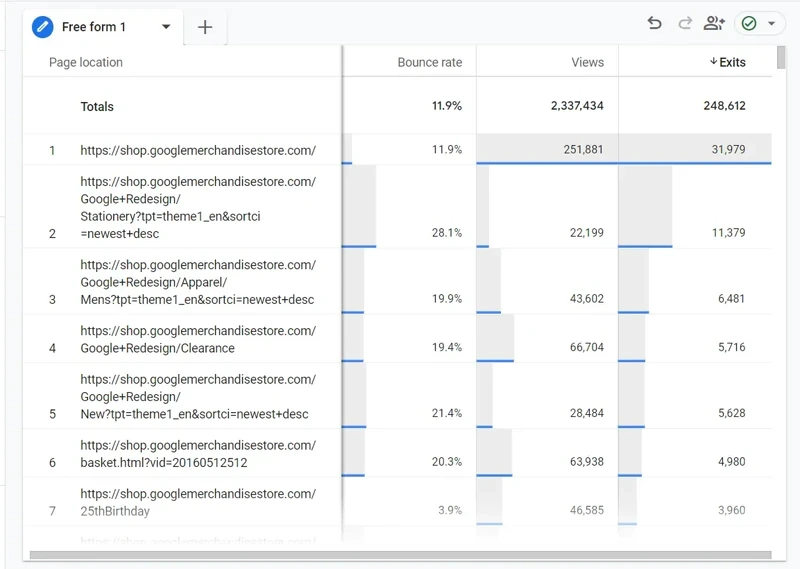
If you compare the Google Analytics bounce rate vs exit, you will notice that the service automatically calculates only the first metric, while you have to calculate the second one manually.
But you can fix it by creating your own custom metric in the application settings. Remember that you will need administrator rights for this. Once created, the form is automatically saved in the service's memory, so you can return to it anytime to update data and select settings.
Regarding Google Analytics bounce rate vs. exit rate, both are important for site owners, marketers, and optimizers.
The bounce rate serves as an indicator of lost revenue. It shows the proportion of users who find your commercial offer attractive enough to click on the link but not good enough to complete the conversion. Of course, it is impossible to reduce it to zero - some users were not going to make the target action. The reasons may be different:
they clicked on the link just out of curiosity;
they don't have enough money for the transaction right now;
they are looking at different offers and will make a choice later;
your competitors are exploring the site;
bots are visiting the page.
The exit level reflects the performance of a particular page. Ideally, a user should leave the site after conversion, as evidenced by:
confirming an order, subscription, file download, or other targeted action;
containing specific information, such as blog articles;
providing visitors with contact information.
But there are also pages for which high exits will definitely be a negative indicator. If a user leaves the home page, they most likely do not like your site's usability. If they depart from the commercial sections, the problem may lie in the product or pricing policy.
Examples of Exit vs Bounce Rate
Consider a simplified commercial website that consists of five pages:
main;
products;
contacts;
blog;
order confirmation.
Let's take five users, each with one session with the following transition sequence:
Home > Blog > Product > Product > Confirmation > Exit.
Home > Exit.
Contacts > Exit.
Home > Blog > Product > Exit.
Blog > Contacts > Exit.
This will be enough to calculate the key metrics for each page. The report looks as follows:
Page | Bounce backs | Exits | Number of sessions | Bounce rate | Exit rate |
Home | 1 | 1 | 3 | 33% | 33% |
Product | 0 | 1 | 2 | 0% | 50% |
Contacts | 1 | 2 | 2 | 50% | 100% |
Blog | 0 | 0 | 3 | 0% | 0% |
Verification | 0 | 1 | 1 | 0% | 100% |
In this case, the contact page has the highest bounce rate and exit rate. But don't interpret these figures as a negative. Visitors may have found the phone number or messenger account they needed to purchase through another sales channel. The site worked effectively in this case, providing the information they needed.
The one hundred percent exit rate on the confirmation page can also be evaluated positively. The user completed the transaction, increasing revenue and profits for the company.
While this doesn't necessarily mean that its further value to you is reduced to zero. You can redirect a user to other pages by:
offering a newsletter subscription;
showing a themed article in a blog;
demonstrating a favorable offer for a related product.
To increase the value of a customer to the company after a purchase is completed, you can use pop-ups. Claspo allows you to draw visitors' attention to lead magnets, such as discounts, in exchange for registering and filling out forms.
Claspo offers a large selection of ready-made templates with different webpage popup formats and display scenarios. You can create a discreet pop-up that will be displayed when they go to a page thanking them for a purchase, when they try to leave the site after a long period of inactivity, or when they scroll through the catalog to a certain point.

The difference between bounce and exit rate in our example is noticeable on the product page. It does not generate bounce rates, which can be considered a good sign. At the same time, a user left it without completing the transaction.
To interpret the metrics correctly, you will need to know the context. If a website owner does not promote the product page with the help of SEO and paid advertising campaigns, the result is easy to explain - it can only be accessed from other sections of the site. Then the 50% level of outputs should be alarming - it shows that not all visitors like your commercial offer.
Zero level of outputs and bounce rate indicates that the blog is working perfectly. It not only gives users relevant information but also redirects them to the product page. Even if conversions never happen, this part of the site doesn't need to be optimized at this point.
The same bounce rates and exits are typical for the main pages of commercial sites. Users navigate to them from the search engine. According to CXL, a visitor needs only 50 ms (0.05 seconds) to evaluate the design of a website and 2.6 seconds to decide on further actions. If customers do not like your website for any reason, they will close it instantly without wasting time exploring other sections.
If the main page collects more exits than bounces, this is a reason to optimize the product policy. Users go to other pages of the site, do not find the goods and services they need, go to the main page, again do not get what they expect and leave the site.
Methods for analyzing the level of bounce rate and exits are individual for each project. To get the correct conclusions, you need to pay attention to the context and behavioral patterns of users. Such analytics will help find the weaknesses of the site and the sales funnel, as well as make the right management decisions and improve the company's marketing policy.
Reduce Bounce Rate and Exit Rate with Claspo
Claspo allows you to use one of the most effective tools of digital marketing - pop-ups. With their help, you can reduce bounce rates and exits on key pages of the site:
offer discounts to users;
make a final offer when a user tries to leave the site;
inform about new additions to the catalog;
redirect to a blog or other commercial pages;
generate personalized coupons.
Claspo can help optimize a customer journey and user experience. For example, a pop-up will direct visitors to high-conversion pages, which can increase leads and targeted actions.
You won't have to learn programming and design or hire experts to use Claspo. The service offers a huge number of ready-made templates that you can customize in the visual editor by simply dragging and dropping the elements you need with your mouse.
Are you still not working with bounce and exit rates? Try Claspo and assess the true effectiveness of your website. Subscribe for free, test the service, and choose the best plan for your business!


