
User Flow Analysis: A Step-by-Step Guide
By analyzing user flows using Google Analytics or other specialized tools, you can better understand the factors that influence user behavior. This allows you to improve key performance indicators of your online business: conversion rate, retention rate, sales, etc. Let's see in more detail what customer flows are, their significance, and the methods used to analyze them.
What is User Flow Analysis
User flow analysis is a detailed diagram of user actions when performing a specific task. Customer flows are separate fragments of the customer journey. Small details of the overall experience are considered, such as registration on the website, ordering a product, seeking advice, etc.
Typically, user flow analysis focuses on specific points of interaction with a company website or mobile app. By considering them separately from the overall customer journey, you can more accurately identify pain points and difficulties company customers face. Eliminating these shortcomings step by step will bring you closer to the ideal cooperation scheme that will allow you to realize the full potential of your business.
A crucial element of user flow analysis is visualization. You can show it in the form of flowcharts, Gantt charts, or even spreadsheets. This helps you better understand user behavior and allows you to quickly make decisions on how to improve the customer experience.
Why is it Important to Monitor Your User Flow
The main reason for website user flow analysis is to find the so-called happy path, which implies perfect interaction with the audience without obstacles, difficulties or pain points.
This gives you a better understanding of user behavior. By carefully studying the pattern of their actions, you can clarify the following things:
- on which page users mostly close the website or mobile app;
- what is the best time to offer assistance when opening an online chat;
- which methods of ordering products are the most effective.
This information allows you to make decisions about design and UX changes. Using it together with A/B testing tools, you can test various hypotheses and choose the perfect solutions based on the specifics of your business and its target audience.
User flow analysis and planning are also often used to improve websites and mobile applications. By visualizing the customer journey broken down into individual steps and detailing the smallest processes, you can optimize the web resource’s structure, navigation, and functionality.
How to Conduct an Effective User Flow Analysis: 6 Steps
Each business has its own specific user flows that influence the choice of analysis methods and tools. We'll consider the general scheme of this process, which will serve as a "framework" for building your individual approach to analytics.
Step 1. Selecting a tool
The first step is to choose a tool for user flow funnel analysis. The free Google Analytics service is the best option for small and medium-sized businesses. It allows you to view user flows in the context of individual segments of the target audience and track specific actions on the website or in a mobile application. Specialized analytics platforms provide more detailed information, for example:
- Userpilot — is a universal product management system that allows you to collect analytics, track user actions on a website or mobile application, and collect feedback.
- Mixpanel — a comprehensive product analytics platform for tracking customer journeys and customer flows. It allows you to test various hypotheses and assess each solution's possible advantages and disadvantages.
- UXCam — is a specialized UX analytics system for mobile applications. It evaluates the impact of each element on conversion, engagement and other KPIs.
These tools can work with multi-channel communication schemes and automatically identify typical patterns of user behavior.
Step 2. Planning
At this stage, it is important to determine why you need to analyze user behavior patterns: to increase the conversion rate of an online store, reduce the churn rate of a SaaS service, increase revenue, etc.
After you choose the goal, you should set specific benchmarks: a 5% increase in conversion, stabilization of the churn rate at 92%, or a 25% increase in revenue during the year. These are the benchmarks you should focus on when conducting user flow analysis.
However, it is worth remembering that implementing such large-scale goals can be a rather long and complicated process. You will also need intermediate indicators (KPIs) to assess the effectiveness of the decisions made. They can be as follows:
- for conversion - engagement rate, duration of website navigation, number of pages visited;
- for churn rate - satisfaction level, NPS rating, average duration of product subscription;
- for revenue - customer lifetime value, cost of individual products, demand structure.
Each company sets individual goals and indicators for achieving them.
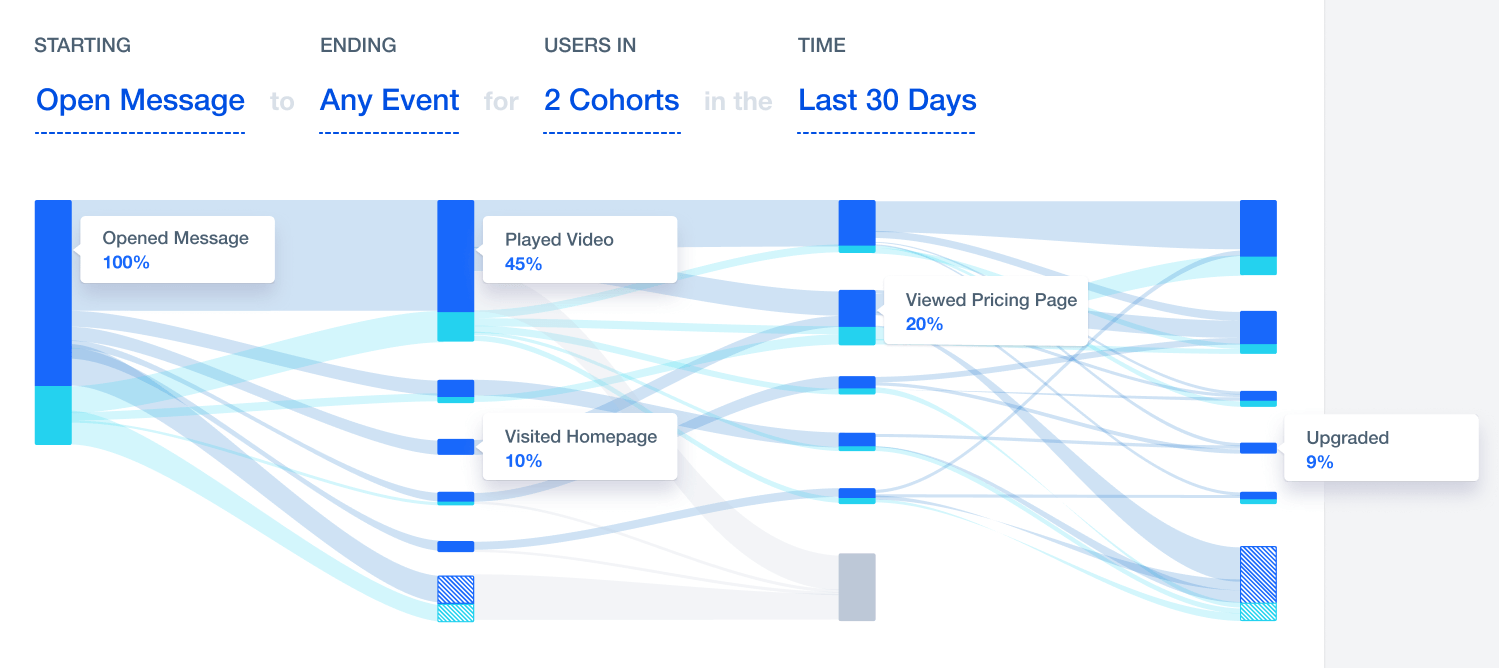
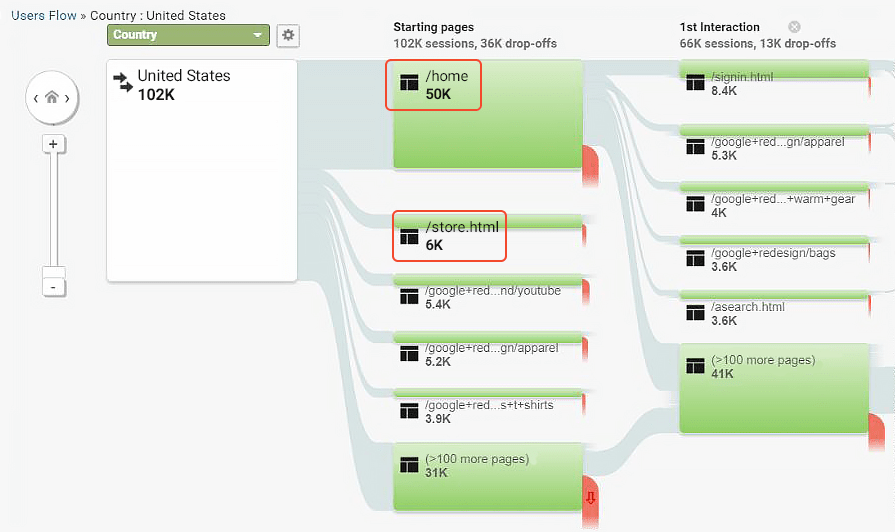
Step 3. Mapping current processes
This stage involves visualizing the current typical patterns of user actions. Fortunately, you don't have to do this manually — you just need to know how to read user flows in Google Analytics or other similar tools. They show the directions for the transition between pages, the frequency of certain routes and the number of users who leave a website at a particular stage. The example below shows that 50% of visitors start browsing the site from the home page and 6% from the commercial pages (store). 16.8% of the former immediately proceed to authorization, and 7.2% to search in the catalog.
In Google Analytics 4, you can view customer flows by country, target audience segments, landing pages and marketing campaigns. This provides a very high level of detail and offers high potential for website optimization.
Another effective way to conduct user flow analysis is to use Google Tag Manager (GTM). It allows you to add personalized tags to specific actions on a page, such as file downloads, completing a form or image clicks. This way, you can get important information even when most users are limited to viewing one page of the site.
Step 4. Analyze the data
Today, it is possible to get the results of user flow analysis even without experience with UX optimization and complex mathematical models. Paid platforms such as Userpilot, Mixpanel, and UXCam offer tools based on artificial intelligence. They automatically identify user behavior patterns, find problem areas and suggest ways to improve the situation.
But you shouldn't rely only on artificial intelligence. You can also do your own research:
- Calculate the time required to perform target actions by each group of users — this function is available even in publicly available Google Analytics;
- Determine the subjective level of complexity of certain processes — you can organize focus groups and conduct internal testing in your company;
- Assess the ease of access to functional elements — calculate the number of steps or even the distance on the screen in pixels.
By involving GTM in the user flow analysis, you can get the most detailed data possible. This will allow you to see where users encounter difficulties and where they efficiently complete their tasks and move on to the next stages of the sales funnel.
Step 5. Optimization
Visualization of typical customer behavior patterns, statistics and analytics data helps you improve your website or mobile app. Let's look at a few examples of effective web optimization solutions from Claspo:
1. Problem: Analysis shows that users spend little time on pages with dense or overwhelming content, like long-form articles or product descriptions. It indicates that they find it difficult to digest long reads and make decisions based on them.
Solution: Claspo widgets can provide additional context or explanations for complex content, allowing users to access more detailed information without overwhelming the website page. For example, you can add a YouTube video with a detailed product overview to your widget or employ our slider to show users the benefits or a step-by-step guide on using the product.
Also, our widgets can prompt users to sign up for your newsletter or receive special educational/explanatory materials in their inboxes. This way, you generate new leads and allow them to engage with the information at their own pace.

2. Problem: User flow analysis shows many users cut checkout short and abandon their carts. It could indicate a cumbersome or confusing checkout flow, such as requiring too many form fields to be filled out, unexpected costs added at the last step or unclear instructions for completing the purchase.
Solution: Claspo widgets can show all the available ways to contact your support team, making it easy for users to seek help if they encounter any difficulties during the checkout process.
In another scenario, display our widget at the beginning of the checkout process to provide a transparent breakdown of all costs involved, including taxes, shipping fees and any additional charges. It helps users understand the total cost upfront and reduces the likelihood of unexpected costs at the last step.
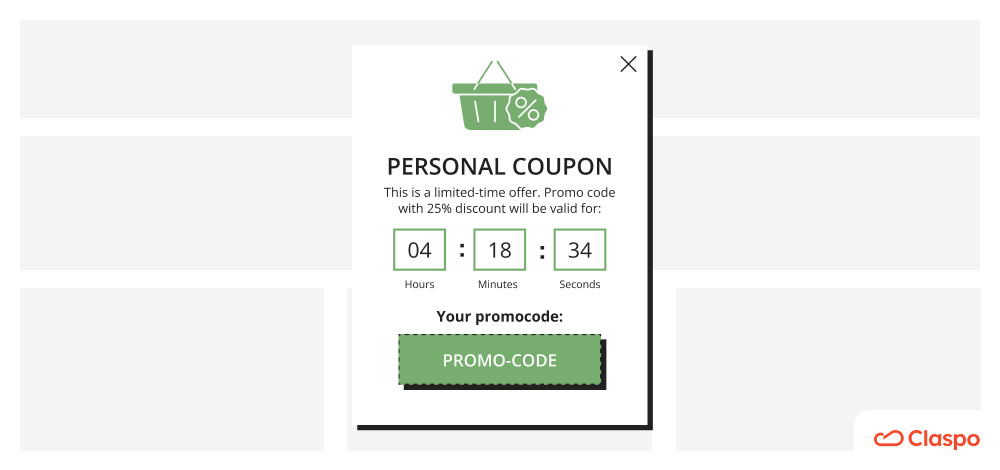
Finally, use Claspo to offer incentives or discounts to users who are hesitant to finalize a purchase. For example, offer a limited-time discount code or free shipping for completing the checkout process, encouraging users to finalize their purchase despite any perceived complexities.
3. Problem: Analysis finds that users hesitate to proceed with a transaction after reaching the payment page, indicating a lack of trust in the website's security or credibility. It could be due to an absence of trust seals, unclear privacy policies or a lack of customer reviews and testimonials.
Another scenario could be users abandoning a registration form after encountering requests for sensitive information without adequate explanations or assurances about how the data will be used and protected.
Solution: Use Claspo widgets to display security badges, your quality and satisfaction guarantees or third-party certifications, assuring users that your website is safe and secure.
With the help of our slider templates, you can show written, photo or video reviews of your customers right on the payment page, dispelling users’ doubts before buying.
Besides, widgets can prompt users to review the website's privacy policy or terms of service before proceeding with sensitive actions like submitting personal information. Our editor has a special "Data processing and terms of use" component. It contains the consent text, a checkbox and a place for an active link to your privacy policy. Add it to your email capture widget or any widget on your checkout page.
4. Problem: Analysis may reveal that users from different regions or language preferences struggle to navigate the website or access relevant content, indicating localization or internationalization issues. It may be due to language barriers or a lack of localized content and pricing information.
Another scenario could be that users leave the website after encountering errors or inconsistencies related to their geographic location, such as unavailable shipping options or special offers not valid for their region.
Solution: With Claspo, you can target your widgets to visitors from specific countries, regions and even cities. Your widgets can inform them about promotions, shipping conditions and available methods in a particular location or show current prices in the relevant currency.
If your website is available in multiple languages, your widget can welcome visitors to the homepage and tell them how to quickly switch to the desired language version.
But most importantly, you can easily set your widget to change its language dynamically. In this case, it will be displayed in a language that matches the user's browser language or the language they select on your website. This way, you improve the user experience, and your offer or other critical information reaches an international audience.
Step 6. Create regular workflows
User flow analysis should be a regular process. Due to the constant changes in target audience segments, website and mobile app structure, business approaches and strategic goals, user flows are constantly changing and require additional optimization.
Therefore, the action plan needs to be amended as described below:
- regular UX audits of websites and mobile applications;
- assessment of the current situation and achievement of goals;
- updating customer flow maps;
- calculation of key indicators;
- studying the best industry practices and competitors' solutions;
- regular A/B testing of your innovations and solutions developed based on analysis.
All this will allow you to launch a continuous optimization cycle.
Claspo allows you to easily set up and run widget A/B testing. However, obtaining really meaningful results requires the right approach to building a hypothesis and conducting an experiment.
With you in mind, the Claspo team has prepared a universal template to guide you through the key stages of A/B testing and help you get the data you need for user flow optimization. Apply this template to validate any hypothesis born from user flow analysis, not just those related to widget usage.
User Flow Analysis: How can Claspo Help
As you noticed above, Claspo comes into play after analyzing user flows. With our widgets for websites, you can fill identified gaps and solve problems easily. There are several central reasons to choose Claspo:
- Creating widgets requires no design or programming skills. So, once you have developed a suitable solution based on the analysis, you can implement it in Claspo in minutes without external help,
- Thanks to our flexible display rules and smart targeting, widgets fit neatly into the user's journey on the site. You can show them on strategic pages at the right moment, increasing the effectiveness of your message and the likelihood of conversion.
- Our free lifetime subscription plan allows you to test all the Claspo functionality and get the first results without spending a single penny.
Try Claspo now and improve your business results!


