What it solves & why businesses use it
CES survey highlights pain points and bottlenecks in the customer journey, allowing businesses to focus on improving those areas and delivering a seamless experience. It answers:
- How much effort does the customer need to exert to complete their goal?
- Are there friction points that are causing frustration?
- How can we make processes smoother and reduce friction?
When & how to use it
Customer effort score survey is typically asked immediately after an interaction to capture fresh impressions of how easy it is for customers to complete their tasks. It’s most effective when triggered during or after key interactions where effort is involved:
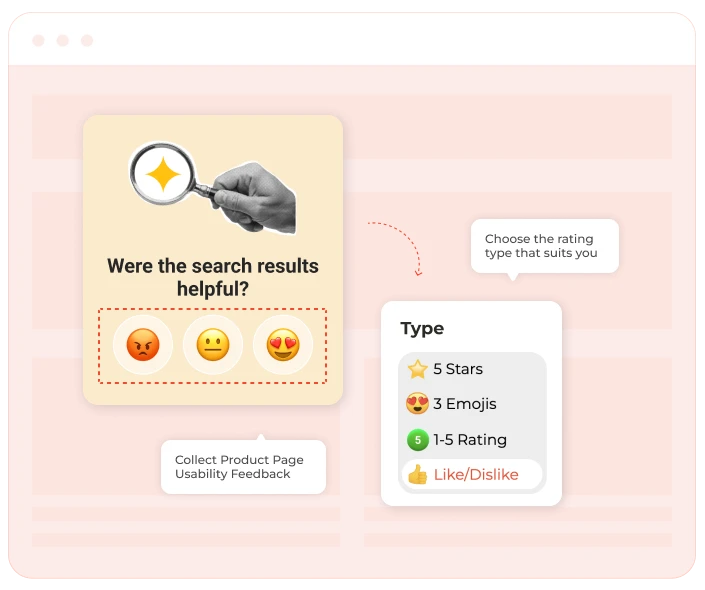
- Website navigation & UX feedback — to identify navigation issues or unclear categories.
- Catalog & search UX — to understand search accuracy issues and missing product tags.
- Product page usability — to ask if they found all the necessary product details or if anything was unclear to improve descriptions.
- Resources & content pages usability — to ask if they found relevant information.
- Pricing page usability — to measure if the pricing structure is clear and if users find the information they need to make a decision.
- During onboarding or account setup — gauge how smooth and simple the process feels for new users.
- After a product issue or troubleshooting — to assess the ease of resolving any challenges customers face.
How it looks
CES survey is typically captured using a simple, one-question survey: "How easy was it to resolve your issue?" or "How easy was it to complete your purchase?"
It’s often rated on a scale of 1-5 or 1-7, where:
- 1 = Very difficult
- 5/7 = Very easy
Some variations use a Likert scale with statements like: "The company made it easy for me to resolve my issue." This is followed by a simple scale:
- Strongly disagree to Strongly agree.
There may also be optional follow-up questions asking for details about what could have been easier, helping you identify specific pain points.
How CES survey is analyzed
CES survey is calculated as a simple average of all responses. If 100 customers complete the survey and the average response is 4.2, it indicates that, on average, customers found the process easy but with room for improvement.
Businesses typically
- Track CES over time to measure improvements in customer experience after process changes.
- Segment CES by customer group (e.g., product type, customer tenure, or issue type) to understand where effort is highest and lowest.
- Compare CES with NPS or CSAT to get a fuller picture of how effort impacts overall customer satisfaction and loyalty.